Tweetable Charts
hunter
2021-05-13
9657 view · 96 likes
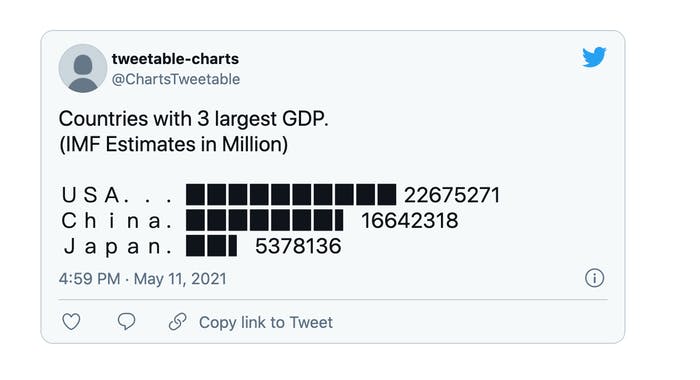
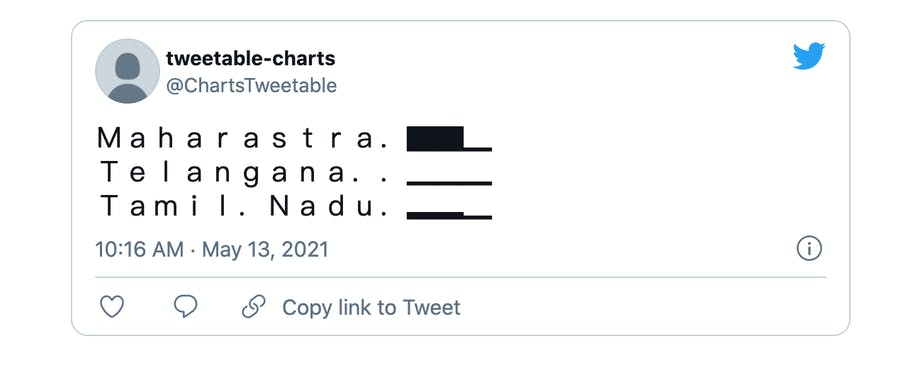
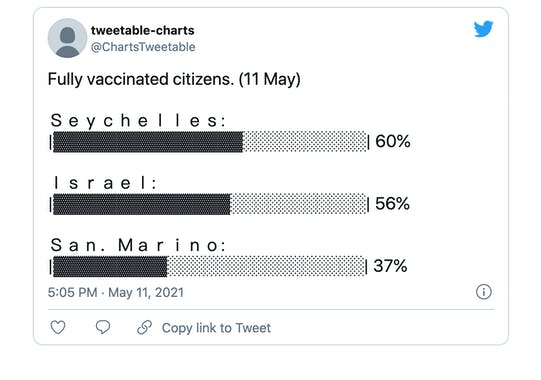
チャートは、1000のデータ点の価値があります。あなたはTwitterで“年進行”チャートを見たことがありますか?どのようなグラフの種類を作成することができます-バー、スパークライン、テーブルを使用すると、右のTwitterのテキストボックス内で使用するか?