Canopy Charts
人人都是产品经理
2022-04-13
2 view · 0 likes
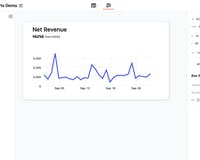
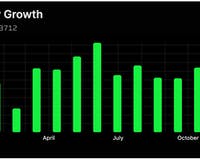
Canopy Charts provides a visual editor for quickly building and customizing beautiful charts. The charts can be embedded in a live app like a React app, or any web page by using an iframe. The charts are powered by live data from a variety of sources.