Charts for Trello by Vizydrop
今日头条员
2019-01-09
60890 view · 608 likes
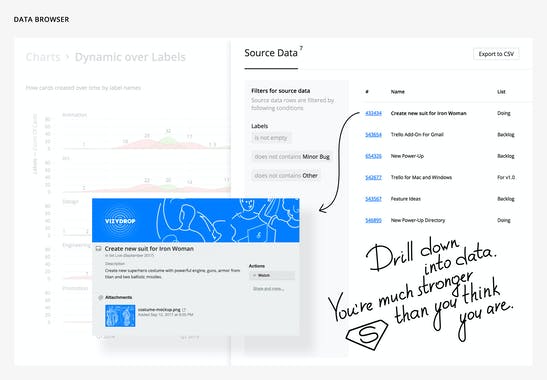
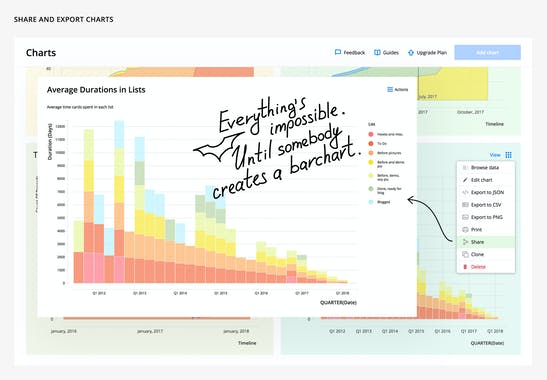
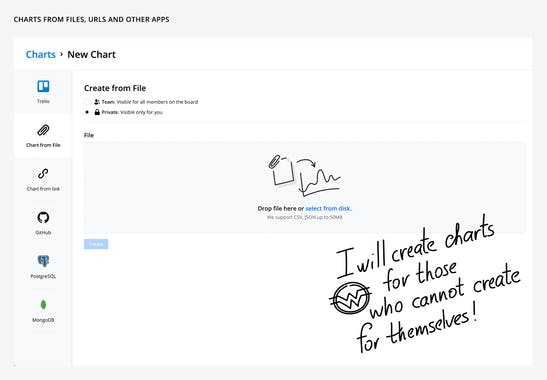
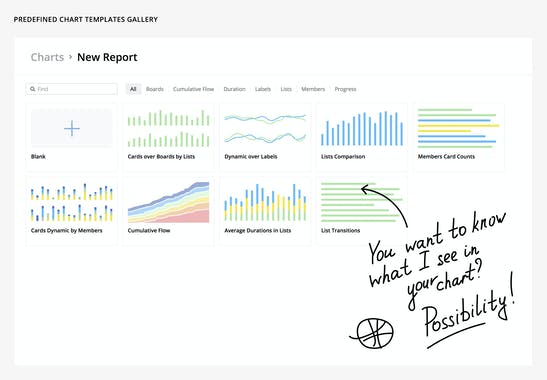
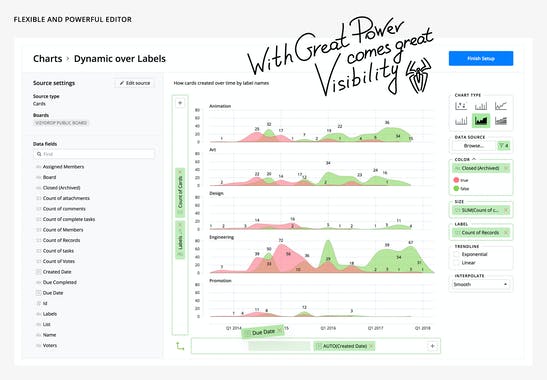
Vizydrop — a business intelligence platform that was created to provide a natural way of exploring data, while staying as easy-to-use as Trello itself. Visualize data from CSV files, links and other apps. Use the simple and flexible editor to build reports.