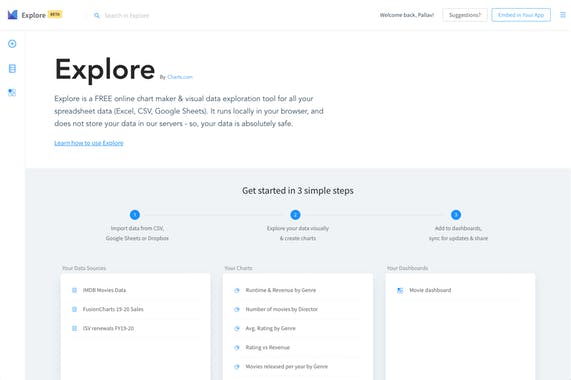
Explore by Charts.com
victor
2020-02-10
31519 view · 315 likes
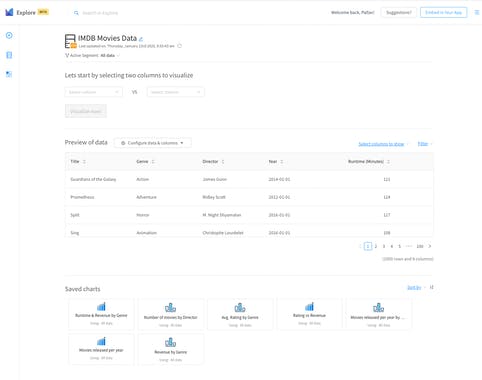
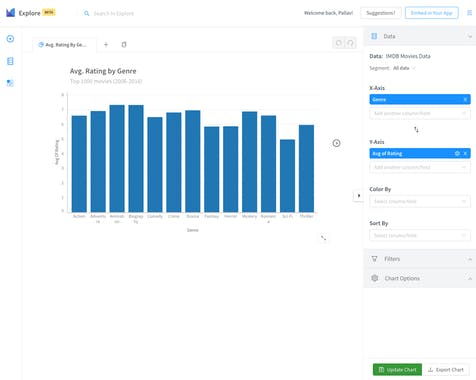
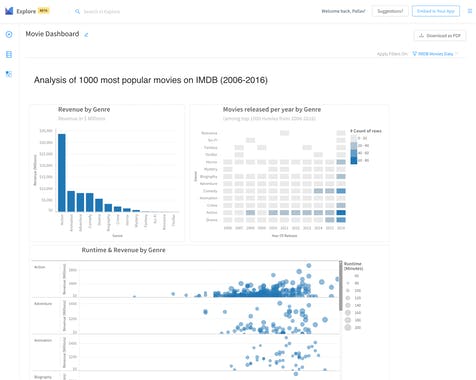
This tool takes in your spreadsheet data (CSV, Google Sheets, Excel in Dropbox etc.) and helps you create charts, visually explore data, create dashboards, sync them with live data, and export PDFs. On the data side, it allows you to create segments, conditional and calculated fields and more.